Machine learning intuition
vivianimbriotis | Sept. 25, 2019, 1:39 p.m.
The phrase “machine learning” is in the news a lot, and for good reason. Voter manipulation, youtube ads, facial recognition, language processing, artificially generated images of cats...machine learning is cool and also kind of spooky. But it gets (at least in some ways) slightly less spooky if you know a little about how it works.
This is intended as a non-technical introduction to the core ideas of machine learning, or supervised learning algorithms, or “artificial intelligence” (as opposed to “artificial general intelligence”) needing no prior knowledge of mathematics or programming; if you’re well-versed in those topics, sorry in advance for eliding over a lot of details - go back to writing x86 assembler code or whatever.
Traditionally, a computer takes in two things - some inputted data, and a program that will be applied to that data; and it generates an output.

Here’s an example:

Now usually, both the input and the output are much more complicated. Microsoft Word is a program whose inputs include the text that you type and the locations on the screen that you click with a mouse cursor, and its outputs include a long number that is interpreted as pixel color and brightness on the screen, displaying your document.
Conceptually, machine learning is slightly different. Instead of taking some input, applying a known process (or program, or algorithm, all synonyms really) to it, and recovering the output of that process, we take a bunch of inputs and a bunch of outputs and try to generate a process that will map those inputs to those outputs - and will map other inputs from the real world to the correct outputs.

That’s kind of confusing, so let’s try an example - and medical school has killed my creativity, so let’s make it a medical example.
Say we have 800 patients, and all of them got special blood tests checking the levels of substance A and substance B in their blood. 10 years later, 300 of these patients had bowel cancer and the other 500 did not. What we’re looking for is a program that will take as input the levels of substance A and substance B in a new patient’s blood, and will output a prediction of whether those tests indicate bowel cancer. We don’t currently know how to build such a program from scratch, but we do have a lot of examples of what outputs should be associated with what inputs from our patient data. We want to use these (input,output) pairs to create a program that we can then apply to new data.
If this sounds more like statistics and less like black magic, congratulations!
Let’s take a look at a graph of this patient data.

Hmm, it kind of seems like when A is high, or when B is high, but not both, then the patient is more at risk of bowel cancer.
Does this patient have an elevated risk?
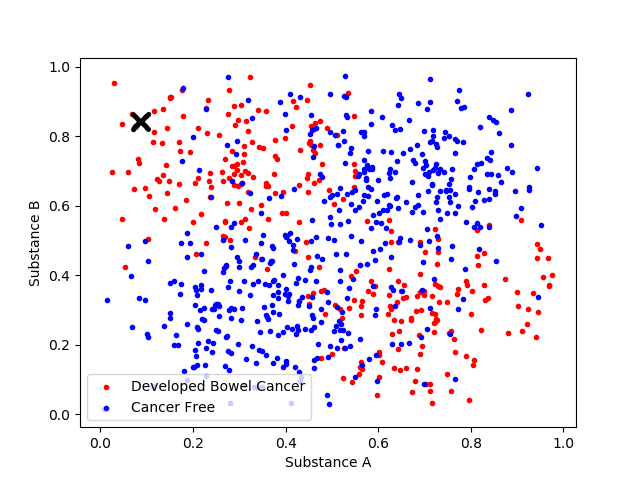
Seems like they probably do to me. What about this one?

Hm, harder to tell.
Well, how about when we get these blood tests from a new patient, we just check whether the patient “closest” to our new patient had bowel cancer? By closest I mean the “euclidean” distance between them - you put a dot on our graph where the new patient’s substance A and substance B concentrations indicate, draw a straight line to every other patient, find the shortest line and check whether that patient got bowel cancer.
This is called the “First Nearest Neighbor” algorithm.
Let’s draw a map of our graph and colour in every point to shows how, given our above 800 points of patient data, First Nearest Neighbour would map each point to high or low risk.

Hmm. It does seem kind of...volatile, or patchy. What about if we looked at the nearest 3 neighbors, and if the majority of those 3 were blue dots (low risk), we’d map that spot to low risk, and if the majority were red dots we’d map that spot to high risk! This is Third Nearest Neighbors, and in general this machine learning algorithm is called K-Nearest Neighbors.

Hmm, I guess that looks a bit nicer.
Now say you test this on some actual patients. That lets you check the accuracy of your model! With some behind-the-scenes magic, drawing from the same well of theoretical patients that I used to create the original data, I get an accuracy of 79% for 3-nearest neighbors, and 73% for 1-nearest neighbor, so it does seem a little better.
Often we’d like to apply machine learning to more difficult datasets. In the “Substance A/Substance B” example, we only had two dimentions to our data (the levels of substance A and substance B), and so we could visualise all our points on a 2-dimentional graph.
Consider the following scenario. There are 34 blood proteins that have been claimed to correlate with worse asthma, and you’ve measured which of the proteins each of 1000 patients has circling in their blood, and then classified them as either having severe or mild asthma. Now, you want an algorithm that will take as input which of those 34 proteins are present in the blood, and output a prediction about severe vs mild asthma!
Well, let’s try implementing KNN on this data - and oh no!! Our accuracy is absolute garbage; when I tried to implement this I got an accuracy of 53%, barely any better than random chance.
This is because KNN is very bad at dealing with high-dimensional datasets - datasets with a large number of inputs, like our 34 blood proteins (this is because of the curse of dimensionality). If we tried another algorithm, we’d have better luck.
Hm, how about we calculate the probability that someone has severe asthma given that they have protein one (by counting up all the people who have this protein AND have severe asthma, and dividing by the total number of people with this protein), and the probability that they have severe asthma given that they DON’T have protein one. Then, we can repeat this approach for each of the 34 proteins, building up a table of conditional probabilities. Finally, we can combine these probabilities for any new patient using the best equation in all of probability theory, Bayes Theorem. This approach is called Naive Bayes.
If that’s confusing, don’t worry too much about it, I just mention it here to make the point that every algorithm has trade offs - for example, Naive Bayes is an algorithm that wouldn’t have worked very well at all on our first dataset, because it assumes that each dimension exerts an independent influence on the output - ie, it assumes that substance A being HIGH is either GOOD or BAD for your chances of getting bowel cancer. But in our example, how your levels of substance A affected your chances of bowel cancer DEPENDED on your levels of substance B! Have another look at our original data.

We can see that, in the case that substance B is high, a high level of substance A seems to reduce your risk. But, in the case that substance B is low, a high level of substance A increases your risk! There is no one best algorithm for all tasks, a fact known as the “no free lunch theorem”. Naive Bayes handles lots of inputs (or dimensions), KNN can deal with pretty much any distribution, but doesn’t handle lots of inputs well. You might have heard of “Neural Networks”, which are a family of learning algorithms.
Hopefully this gave you some intuition for the core features of machine learning - that it gets more accurate the more training data you have; that it’s a tool for extracting programs, or methods of problem-solving, or knowledge from piles of data; that different machine learning algorithms are suited for different tasks; and that it’s not magic.
For further reading, I seriously recommend the Cornell CS4780 course, which you can view in its entirety (including lecture notes linked in the descriptions of videos) here.
About Viv
Mid-twenties lost cause.
Trapped in a shrinking cube.
Bounded on the whimsy on the left and analysis on the right.
Bounded by mathematics behind me and medicine in front of me.
Bounded by words above me and raw logic below.
Will be satisfied when I have a fairytale romance, literally save the entire world, and write the perfect koan.
Patient narratives are either fictionalized or heavily composited.